This function performs a linear regression of Y on X and removes the fitted trend from Y,
effectively flattening it to a horizontal baseline while preserving its residual variation.
The corrected values are returned as a new column Y_corrected in the input data frame.
Value
A data frame identical to df, with an additional column Y_corrected representing
the detrended version of Y, centered around its original mean.
Examples
set.seed(123)
df <- data.frame(
X = 1:100,
Y = 0.5 * (1:100) + rnorm(100, sd = 5)
)
df_corrected <- correct_to_horizontal(df)
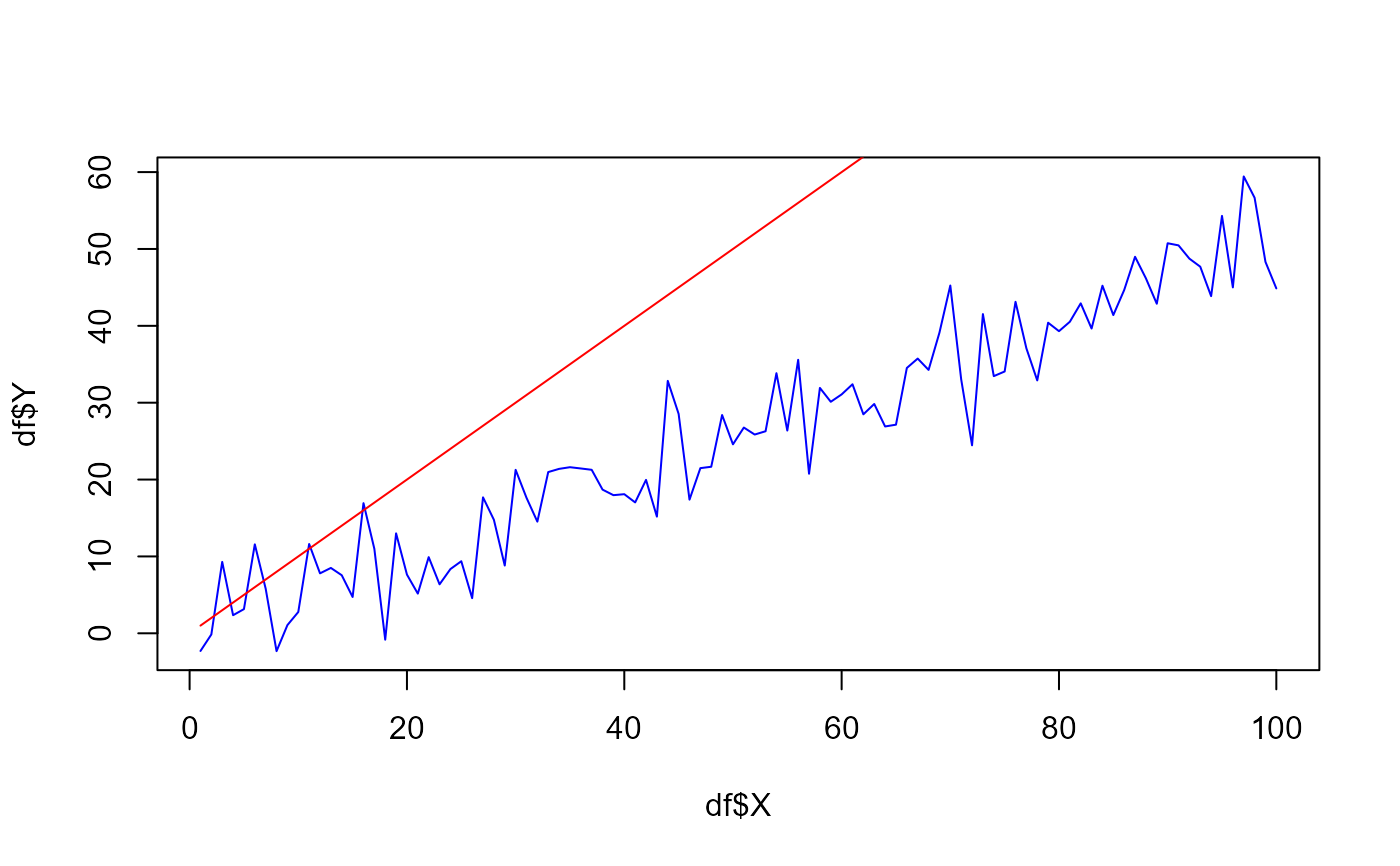
plot(df$X, df$Y, type = "l", col = "blue")
lines(df$X, df_corrected$Y_corrected, col = "red")